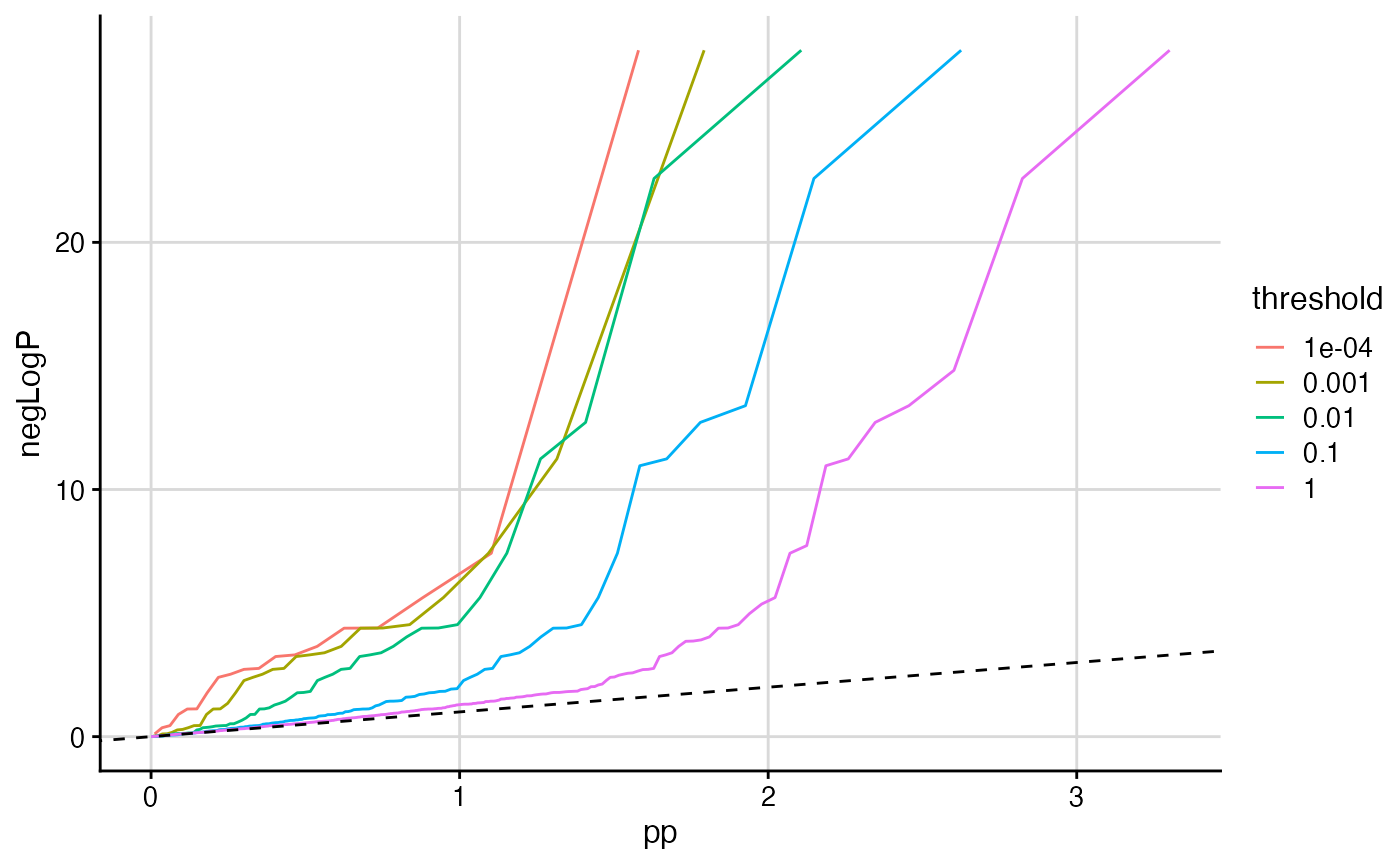
Stratified Q-Q plot.
stratified_qqplot.RdStratified Q-Q plot.
stratified_qqplot(
  data_frame,
  prin_value_label,
  cond_value_label = NULL,
  thresholds = c(1, 0.1, 0.01, 0.001, 1e-04)
)
Arguments
| data_frame |
|
|---|---|
| prin_value_label | label of principal p-value column in |
| cond_value_label | label of conditional trait column in |
| thresholds | threshold values to define strata |
Value
ggplot object
Details
Can be used to investigate the relationship between p and q
Note that this function does not do the heavy lifting of styling the plot's aesthetics.
Examples
# In this example, we generate some p-values (representing GWAS p-values)
# and some arbitrary auxiliary data values (e.g. representing GWAS p-values for a related trait).
# We use the stratified_qqplot() function to examine the relationship between p and q

# generate p
set.seed(1)
n <- 1000
n1p <- 50
zp <- c(rnorm(n1p, sd=5), rnorm(n-n1p, sd=1))
p <- 2*pnorm(-abs(zp))

# generate q
zq <- c(rnorm(n1p, sd=4), rnorm(n-n1p, sd=1.2))
q <- 2*pnorm(-abs(zq))

df <- data.frame(p, q)

stratified_qqplot(data_frame = df, prin_value_label = "p", cond_value_label = "q")